Order Flow Analysis
See what price-only indicators miss. Four real-time algorithms reveal the true market structure behind every candle.
Key Capabilities
CVD (Cumulative Volume Delta)
Every trade on Coinbase and Kraken classified as buyer-initiated or seller-initiated. Green bars mean aggressive buying. Red bars mean aggressive selling. When price goes up but CVD stays flat, the rally lacks real conviction.
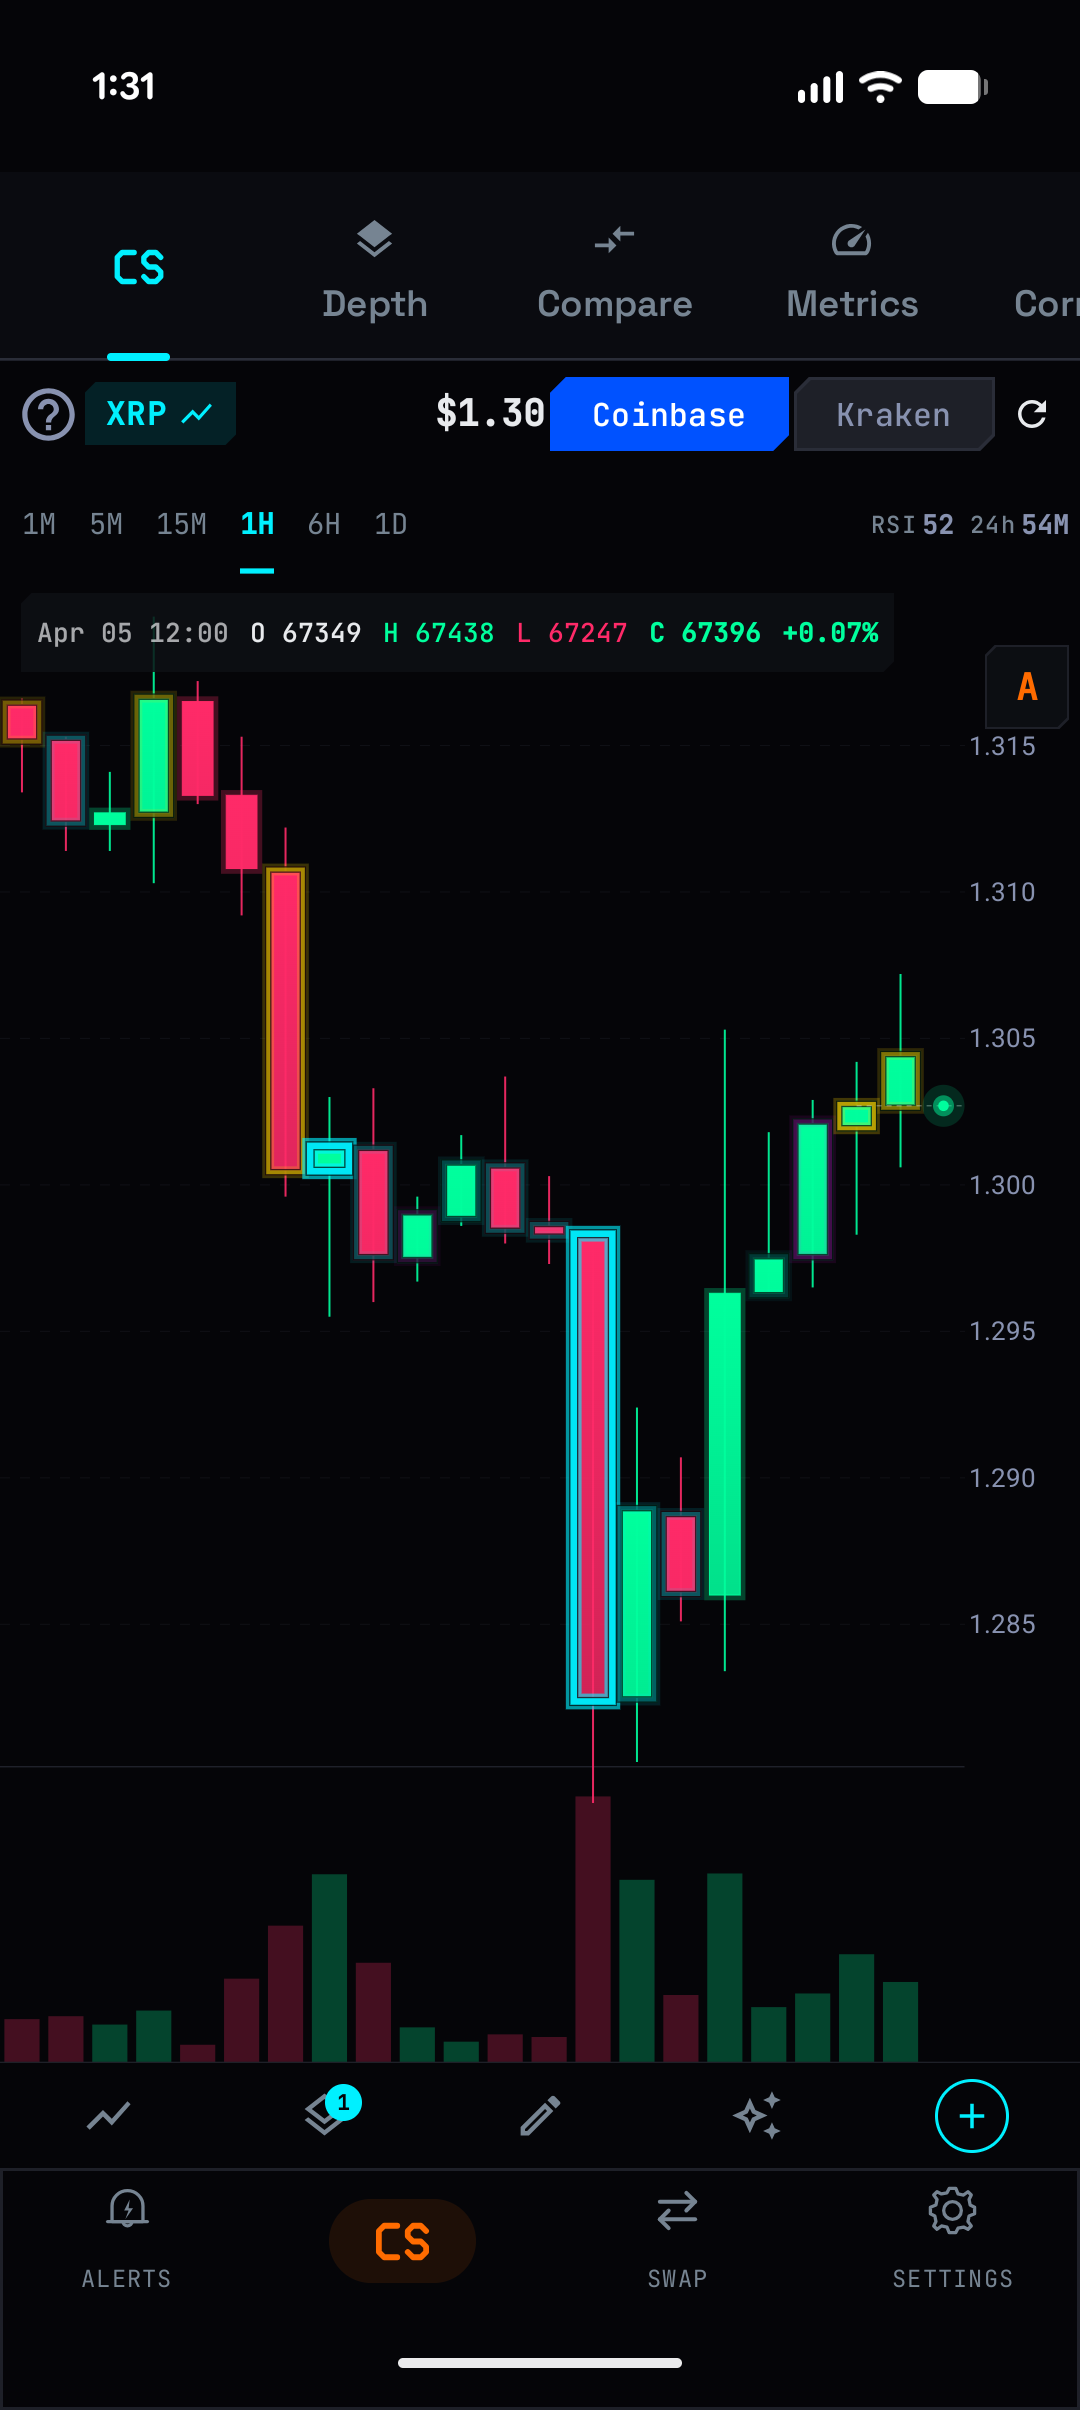
LBI (Liquidity Behavior Index)
One composite score from -100 to +100. Combines trade flow delta (35%), liquidity imbalance (25%), spoofing detection (20%), and footprint analysis (20%). Candles glow with conviction. Cyan for bullish flow, magenta for bearish flow. Brightness and layer count scale with magnitude — from single-layer border to triple-layer radiant glow.
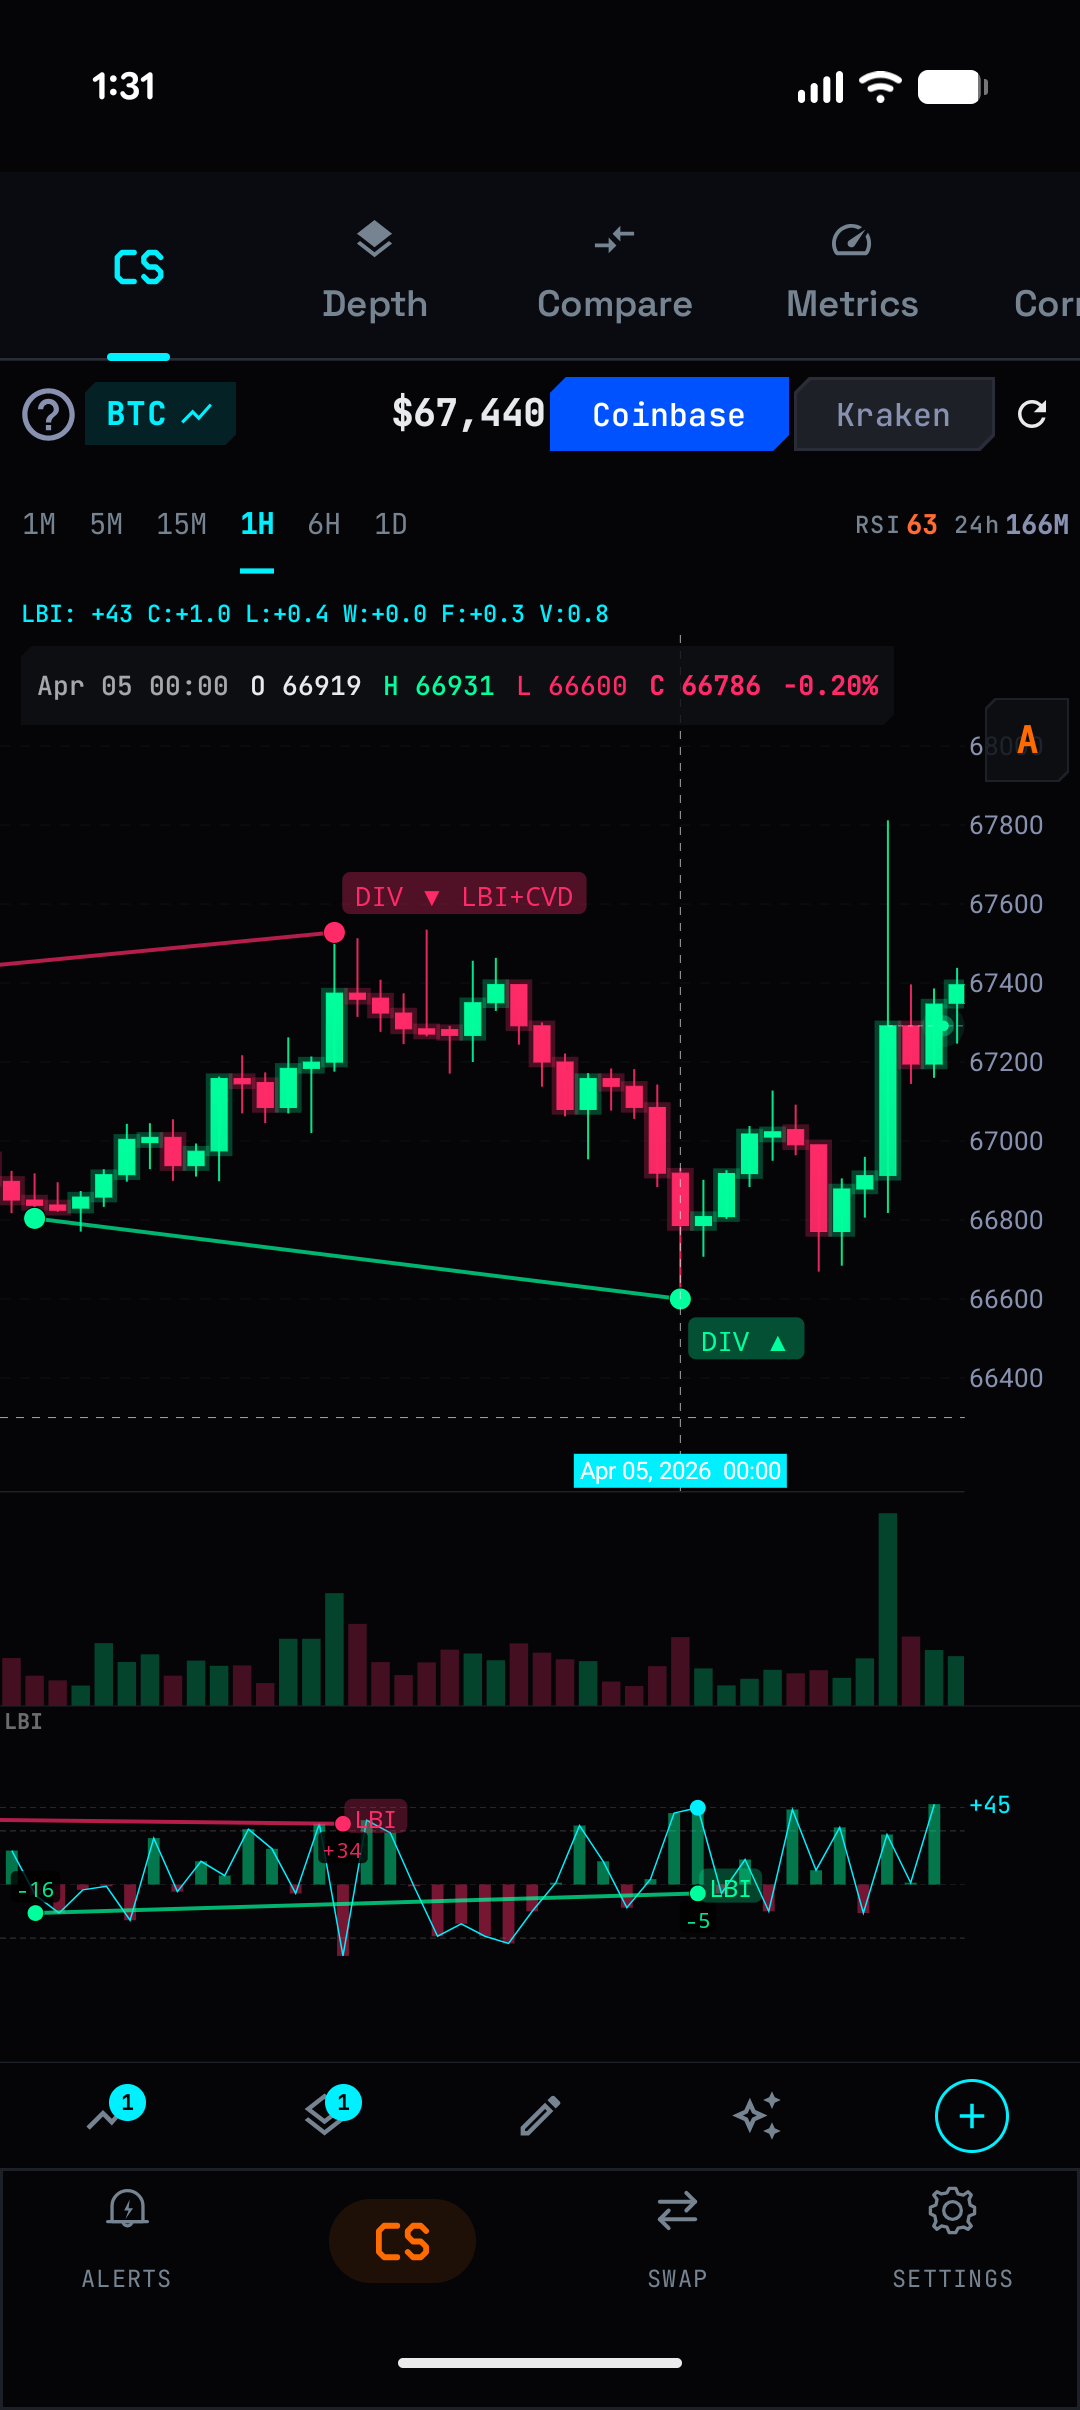
Flow Divergence Detection
Automatic detection when price diverges from order flow. Price makes a Higher High but LBI makes a Lower High — flagged as "DIV LBI+CVD" when two indicators confirm. ATR-based adaptive pivots. Signals never repaint. Available for the top 5 coins: BTC, ETH, SOL, XRP, ADA.
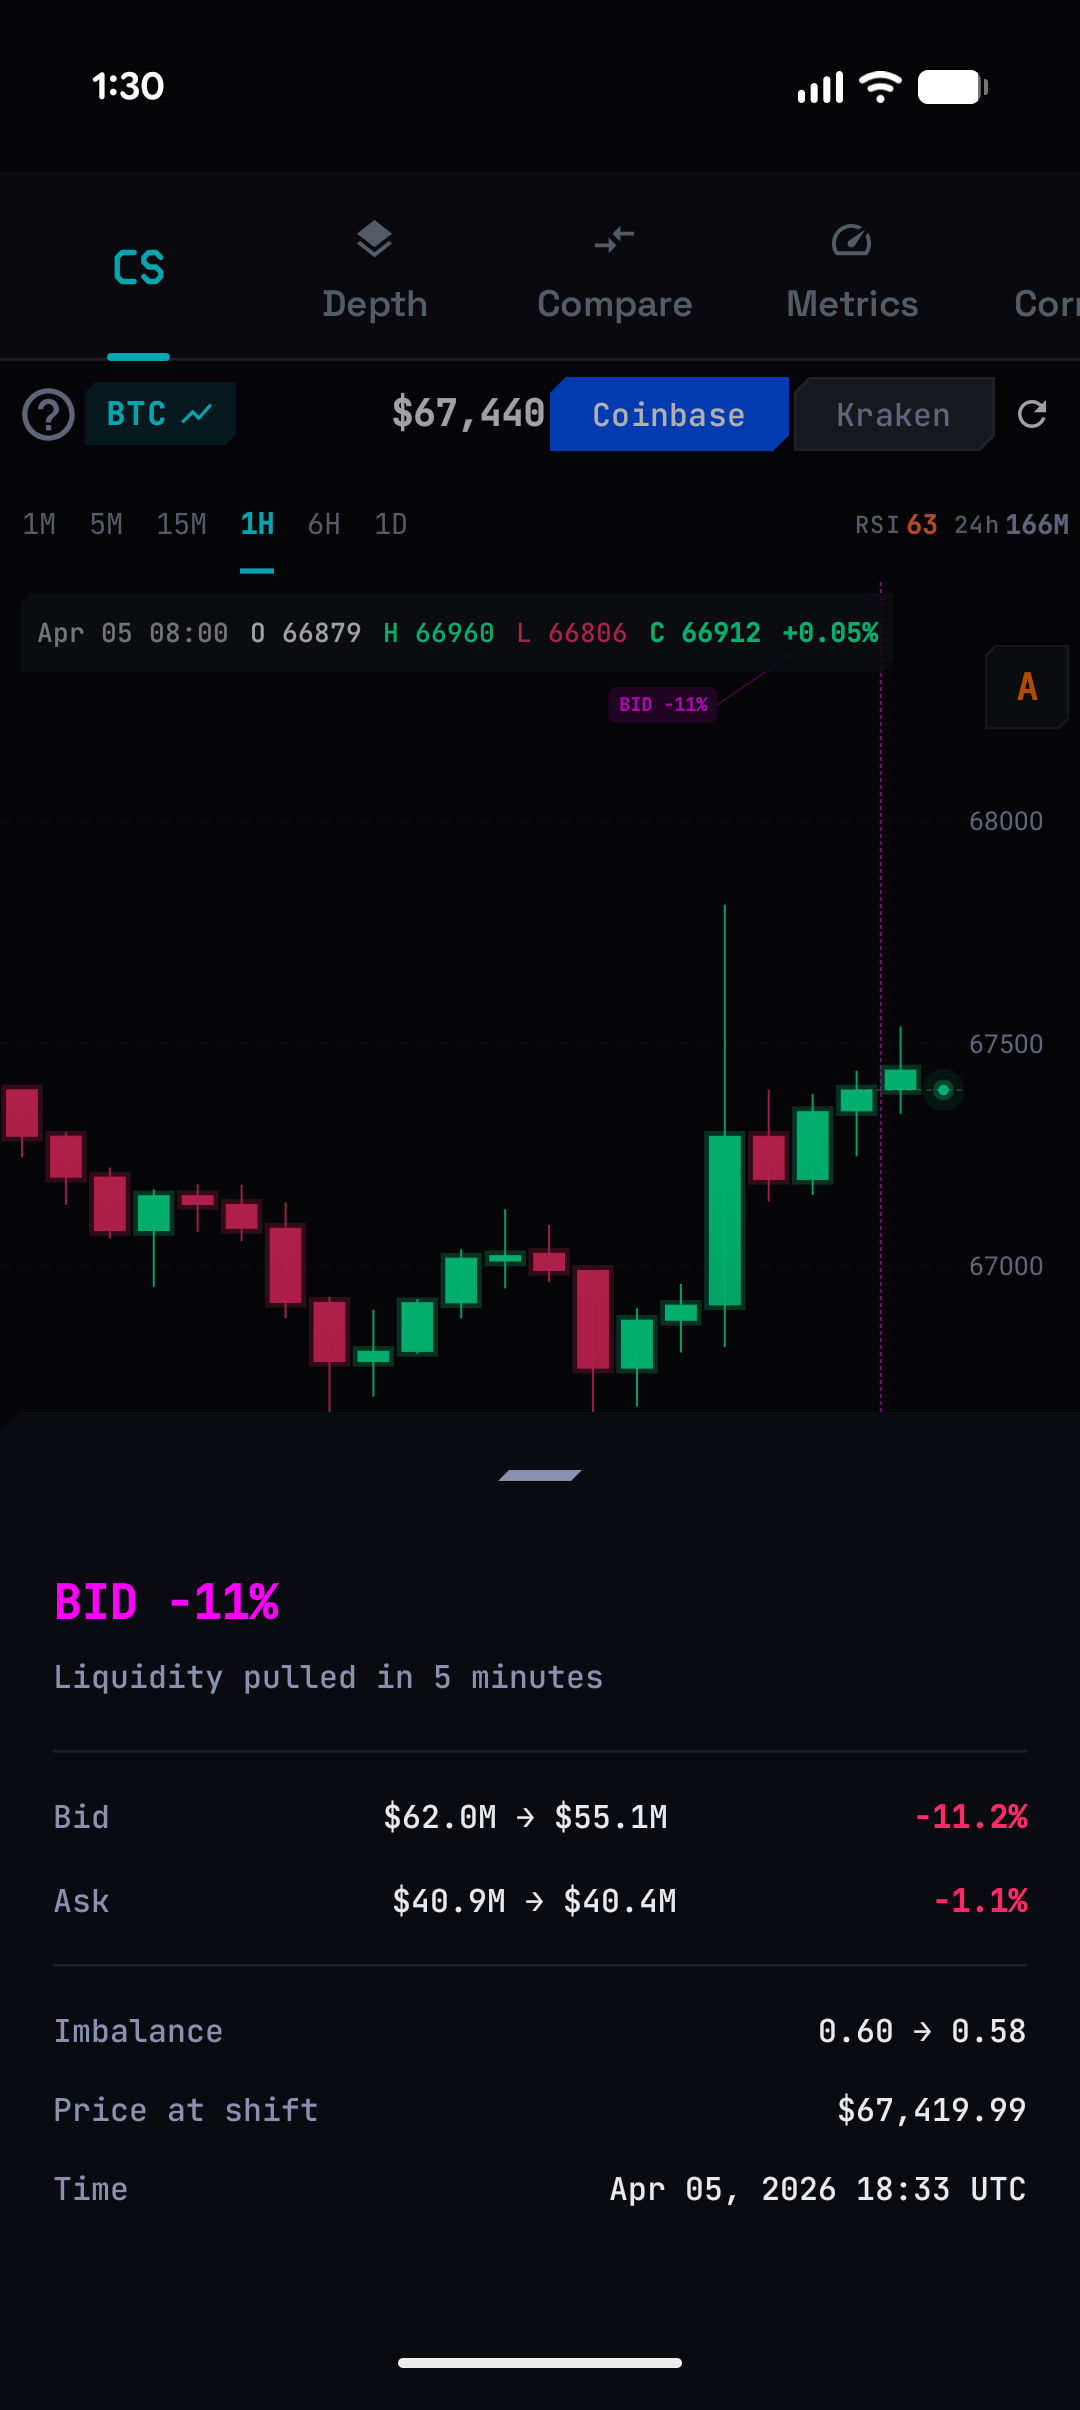
Liquidity Shifts
Structural changes in order book detected within 30 seconds. Bid surges, ask drains, and imbalance flips appear as markers on your chart. When millions in bids vanish or appear, you see it before the price reacts.
Try It Now
Download ChainVol on Google Play and start your 14-day free trial — every feature included.