PRO

Footprint Chart

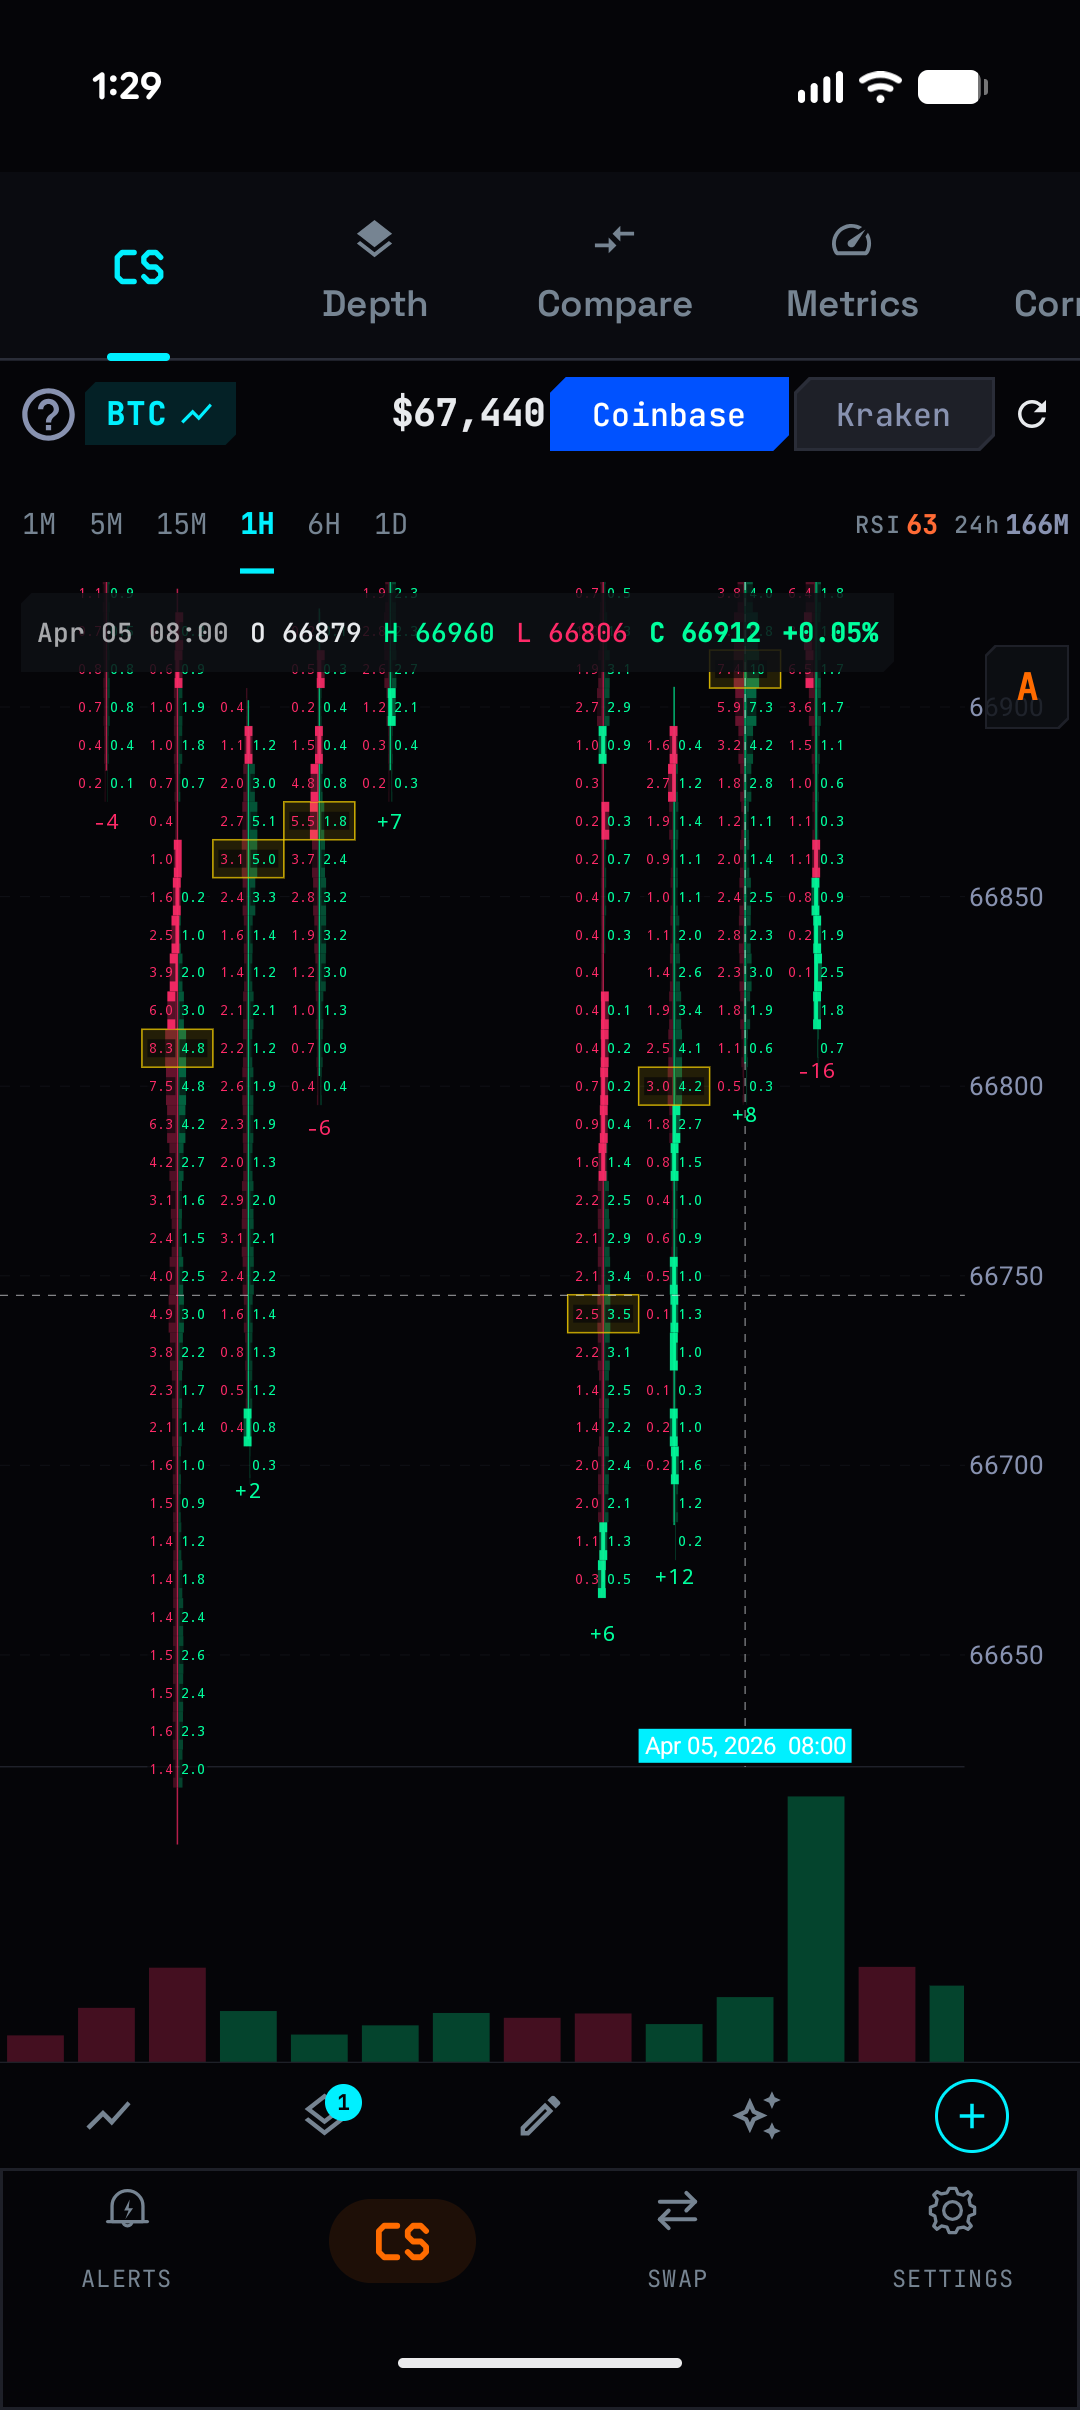
See buy and sell volume at every price level inside each candle. The most detailed view of market microstructure available on mobile.

Footprint chart with per-level buy/sell numbers

What It Does

A regular candlestick shows open, high, low, close, and total volume. A footprint chart shows WHERE inside that candle the volume happened. At $67,000 there were 8.3 BTC bought and 4.8 BTC sold. At $66,950 it was 2.1 bought and 6.3 sold. This level of detail reveals the internal structure of every price move.

ChainVol builds footprint data from real tick-level trade data via WebSocket for top coins (BTC, ETH, SOL, XRP, ADA) with 99%+ accuracy. For other coins, it uses lower-timeframe candle aggregation with CLV estimation.

Key Capabilities

Per-Level Volume

Buy and sell volume displayed at each price level. Green numbers on the right (buys), red on the left (sells). Delta shown for each level. Yellow highlight on imbalance levels.

POC (Point of Control)

The price level with the highest total volume in each candle — highlighted automatically. This is where the most trading activity occurred.

Delta Analysis

Total delta (buy - sell) shown per candle. Positive delta with a red candle means hidden buying. Negative delta with a green candle means hidden selling.

How To Use

1

Open Chain Studio on any coin

2

Tap the layers button and enable Footprint (FP)

3

Candlestick bodies are replaced with per-level volume numbers

4

Zoom in to see individual price levels with buy/sell breakdown

5

Yellow-highlighted cells indicate significant imbalance at that level

6

Use with LBI oscillator for complete order flow context

Try It Now

Download ChainVol for free on Google Play. PRO features available via subscription.

Get it on Google Play