Order Flow
Liquidity Heatmap
Visualize order book depth over time. See where liquidity clusters, dissolves, and shifts — in real time.
Key Capabilities
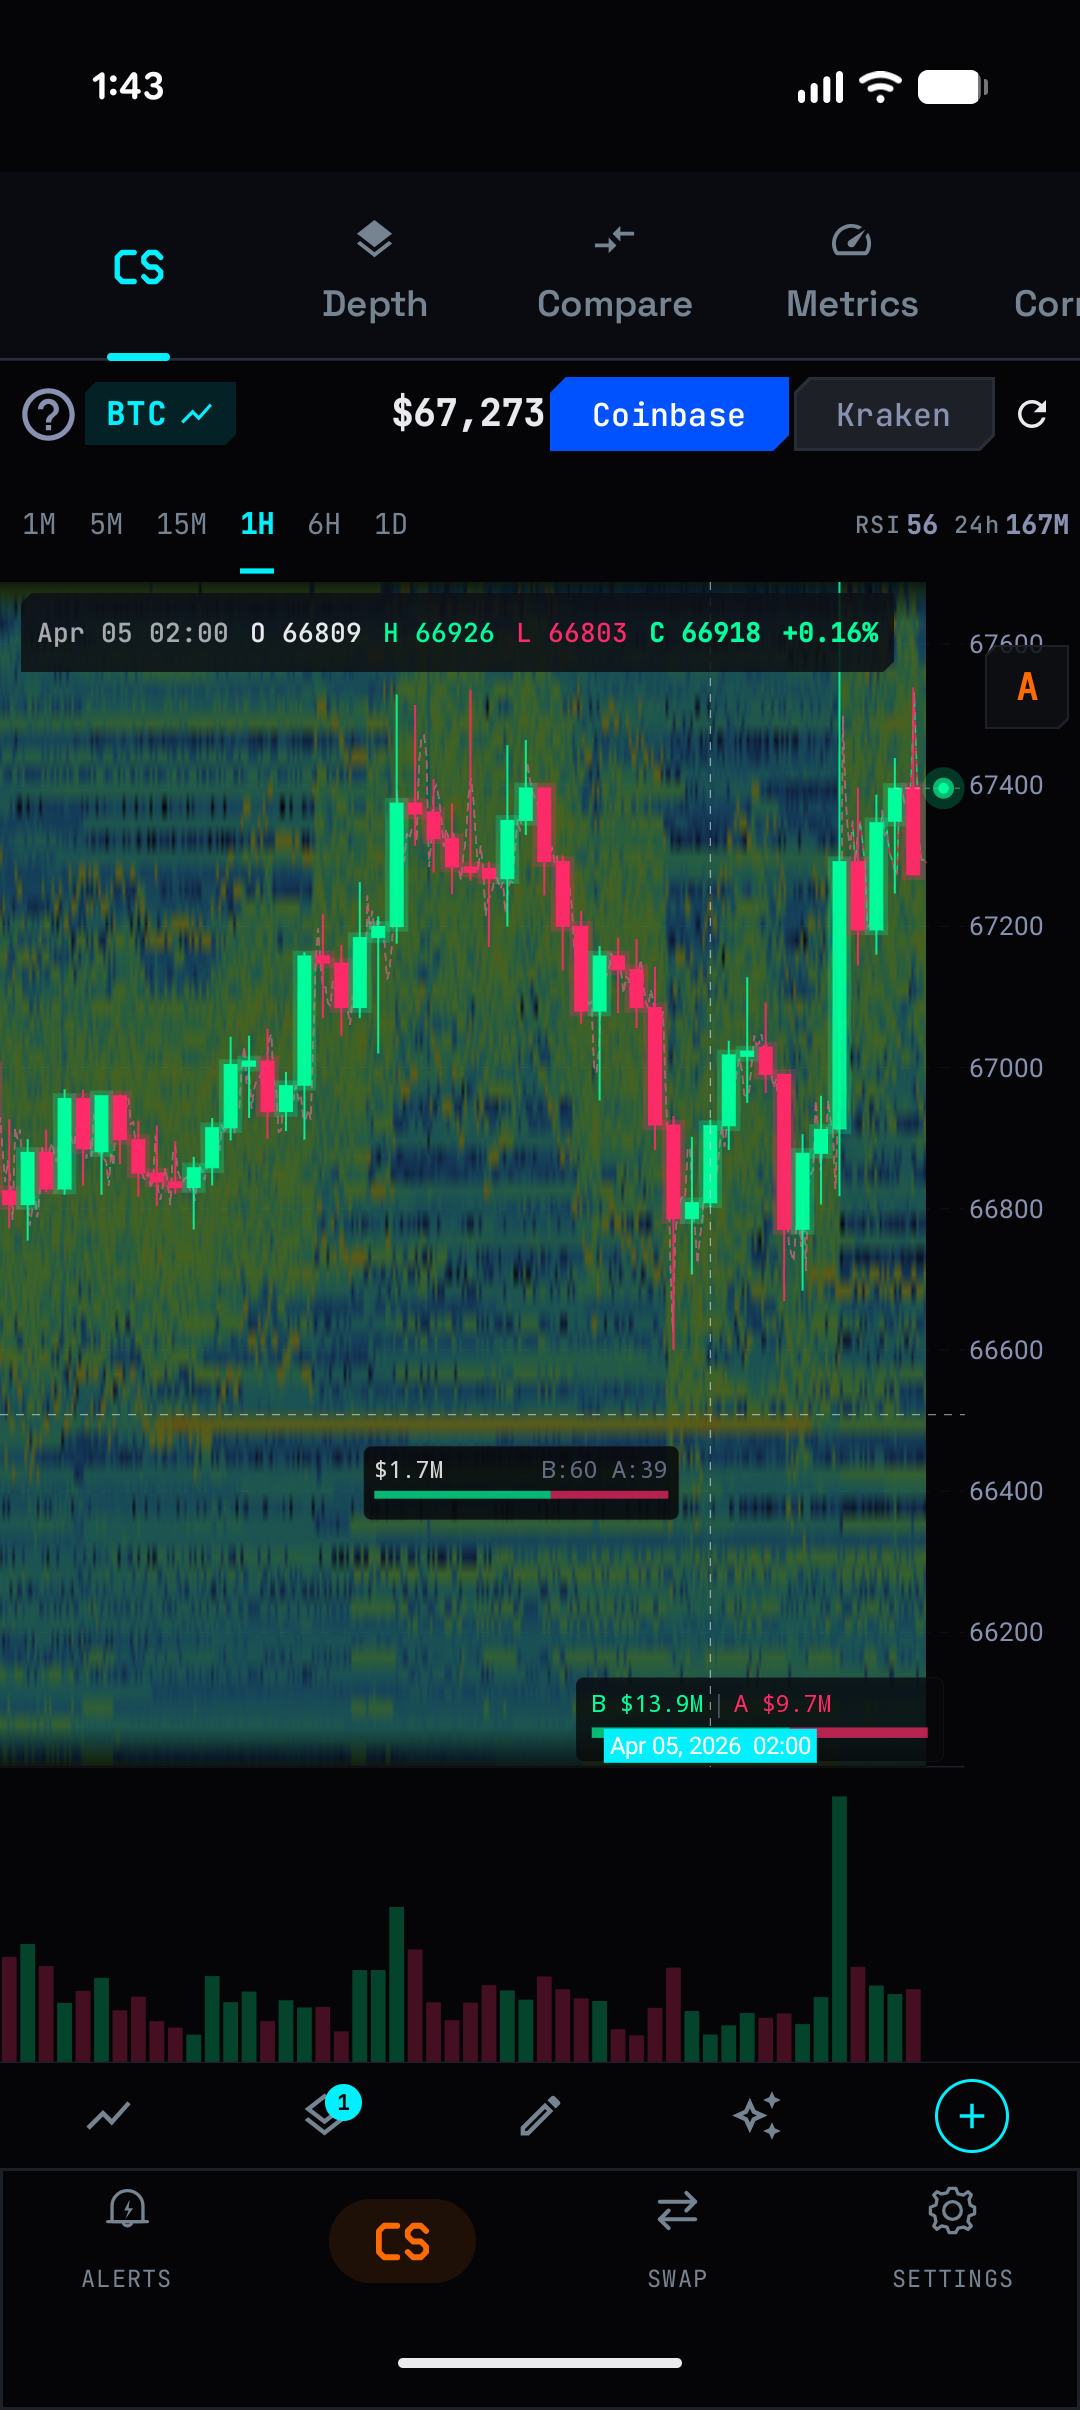
Thermal Map
Color gradient showing order book depth over time. Bright zones indicate concentrated liquidity. Crosshair shows exact values: volume, bid/ask ratio, price level.
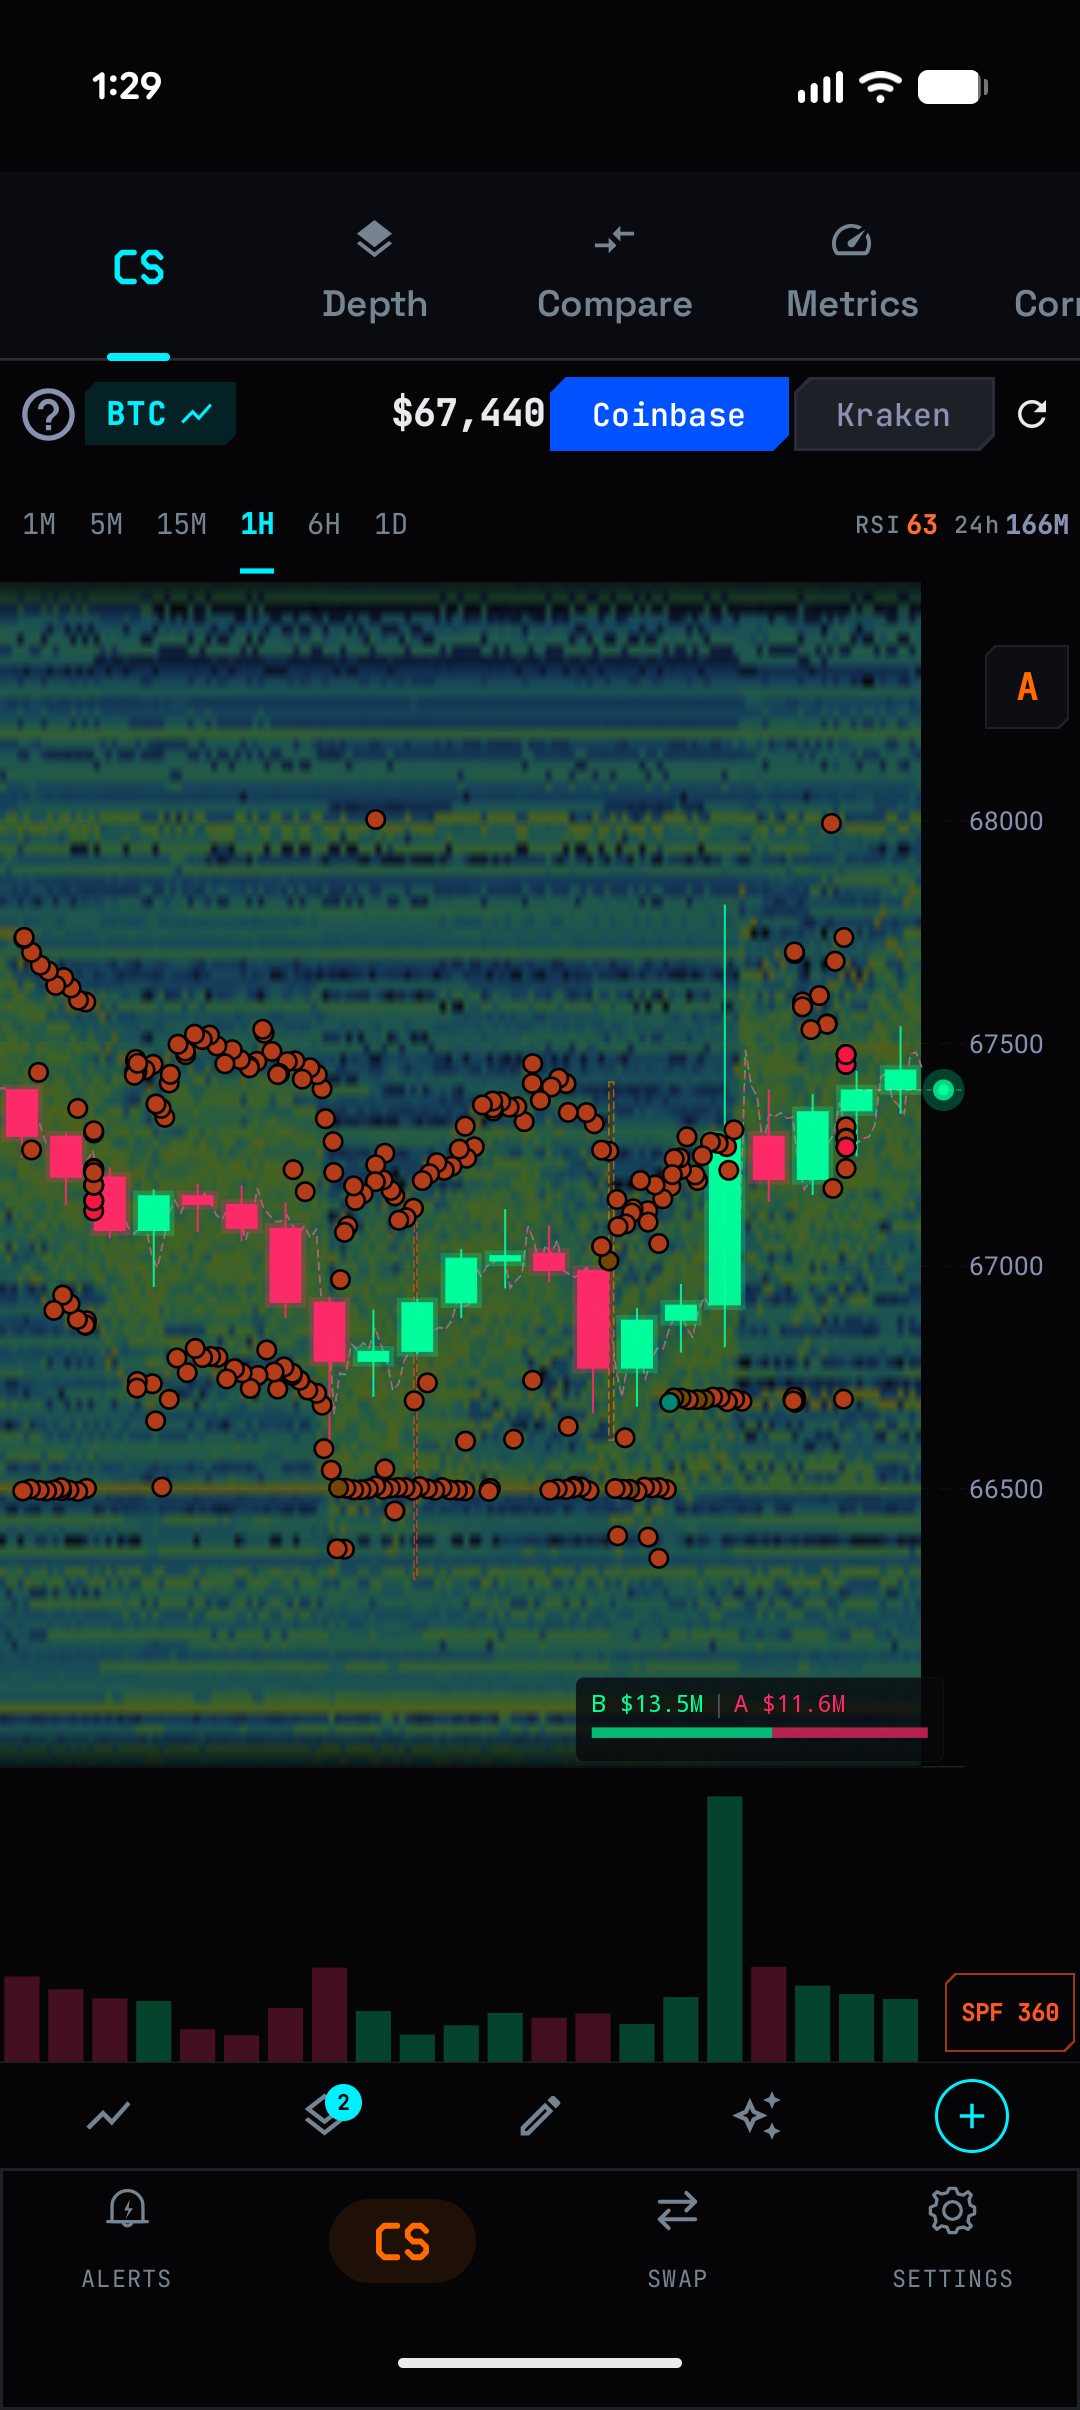
Order Map
Overlay showing whale orders, best bid/offer markers, and wall positions directly on the chart.
Crosshair Details
Tap any point on the heatmap to see: total volume at that price/time, bid vs ask breakdown, and imbalance ratio. The bottom bar shows total bid and ask USD values.
Screenshots
Try It Now
Download ChainVol on Google Play and start your 14-day free trial — every feature included.